
By Sam, Operations Head at GrowthEdge Marketing · Last updated: October 2, 2026

Good digital PR measurement works in four layers: coverage, search, AI visibility, and business impact. Report only the metrics that prove the goal you set at the start, and leave out everything else. That one rule fixes the kind of PR report leadership doesn’t trust: pages of publication logos, “potential reach” figures in the hundreds of millions, and no clear link to anything the business cares about.
Measurement is also where the industry is still catching up. BuzzStream’s 2026 State of Digital PR survey of more than 150 practitioners found that 85.1% judge success by quality links. Far fewer track whether that coverage turns into leads and sales, and the share that does has declined since 2025.
This guide covers the digital PR metrics to track in each layer, which ones to drop, and a simple monthly report you can copy. If you haven’t set goals for your program yet, start with our guide to building a digital PR strategy from scratch, because every metric below depends on them.
In this article
- Start With a Baseline and a Goal for Every Metric
- Layer 1: Coverage and Link Metrics
- Layer 2: Search and Traffic Metrics
- Layer 3: AI Visibility
- Layer 4: Business Impact and Digital PR ROI
- Digital PR Metrics to Stop Reporting (or Treat With Care)
- A Simple Monthly Digital PR KPI Report
- Measure What Proves Your Goal
- FAQs

Start With a Baseline and a Goal for Every Metric
You can’t show improvement without a starting point. Before your first campaign goes out, record where you stand on:
- Referring domains linking to your site
- Rankings and organic traffic for the pages you want to grow
- Branded search clicks and impressions
- Referral traffic from news and media sites
- How AI assistants describe your brand, if they mention it at all
Then apply one test to every metric you plan to report: which goal does this prove? A link-building program should be judged on links and rankings. A program meant to build trust with buyers should be judged on coverage in the right trade titles and on branded search. If a number doesn’t connect to a goal, leave it out of the report.
AMEC, the international association for communication measurement, offers a useful way to structure this. Its Integrated Evaluation Framework separates outputs (what you put out and audiences receive, such as media coverage), outtakes (what audiences take from it, such as attention and awareness), outcomes (longer-term effects, such as trust and preference), and impact (results that contribute to the organization’s goals). The four layers below follow the same logic, adapted for digital PR.
Layer 1: Coverage and Link Metrics
These are your outputs, the most direct evidence that a campaign landed.
Quality links. Count links from relevant, editorial placements, not just links. One link from a respected trade publication in your industry is usually worth more than ten from loosely related sites. Report followed and nofollow links separately. Followed links pass ranking signals; nofollow links still bring referral traffic and visibility.
Coverage by tier and message. Group coverage into national, trade, and local or regional publications. A breakdown such as “4 national, 9 trade, 6 local” tells a far clearer story than “19 pieces of coverage.” Then check whether that coverage actually carries your key message or data point, or just mentions your name in passing.
Unlinked brand mentions. Many articles mention a brand without linking to it. Track these separately and politely ask the publication to add the link. It’s one of the easiest ways to recover value you’ve already earned.
Sentiment. Note whether each piece is positive, neutral, or negative toward your brand. Most digital PR coverage is neutral to positive, but a negative or misleading story is worth knowing about early, and the overall mix matters for brand trust.
Syndicated coverage. One story often gets republished across a network of sister sites. Count the original placement and its copies separately, so your coverage total isn’t inflated.
These metrics are the industry standard. In BuzzStream’s survey, 85.1% of practitioners use quality links, 72.3% use total mentions, and 70.9% use total links. For more on why links from coverage matter for rankings, see how digital PR supports SEO.
Layer 2: Search and Traffic Metrics
Coverage is only worth earning if it changes how people find you. This layer shows whether it did.
Referral traffic
In GA4, check sessions coming from the publications that covered you. Look beyond volume: engaged sessions, pages viewed, and conversions show whether readers were actually interested. A small amount of highly engaged traffic from a trade publication can be worth more than a spike from a viral story.
Rankings and organic traffic to target pages
Track the pages that received links, not just the whole site. If your campaign linked to a research page or a service page, watch that page’s rankings and organic clicks over the following months, including growth in non-branded searches. Expect a lag: search improvements from new links rarely show up the week coverage lands.
Branded search
Growth in branded search is one of the clearest signs that PR is building awareness. In November 2025, Google added a branded-queries filter to Search Console’s performance report for eligible properties. It separates searches that include your brand name from everything else, without the manual regex filters teams used to rely on. Compare branded clicks and impressions before and after major campaigns.
Share of voice
Share of voice compares your visibility with your competitors’. For digital PR, that usually means your share of media coverage on your core topics, or your share of branded searches compared with competing brands. It puts your own numbers in context: 20 pieces of coverage look very different if your main competitor earned 200.
How much weight practitioners give search metrics is shifting. In BuzzStream’s survey, 63.5% use organic traffic and rankings to judge success, down from 78% the year before. Search still matters, but it’s no longer the only lens.
Layer 3: AI Visibility

This is the newest layer, and it’s quickly becoming one of the most important.
Muck Rack’s May 2026 “What Is AI Reading?” study analyzed more than 25 million links cited by ChatGPT, Claude, and Gemini. It found that 84% of AI citations come from earned media. More than half of the journalism those tools cited had been published within the previous 12 months. In practice, the coverage you earn now helps shape how AI assistants describe your category and whether they mention you.
Practitioners are responding. In BuzzStream’s 2026 survey, 55.4% now track AI citations or mentions, the first year the metric appeared.
Two practical ways to measure it:
- A monthly prompt check. Write a fixed list of 10–20 questions your buyers would actually ask, such as “best fintech PR agencies” or “how to get media coverage for a SaaS launch.” Each month, ask them in ChatGPT, Gemini, Claude, and Perplexity. Record whether your brand appears, how it’s described, and which sources are cited. Keep the questions the same every month so the results are comparable.
- AI referral traffic in GA4. Create a custom channel group or segment for referrals from sources such as chatgpt.com, perplexity.ai, and gemini.google.com. Some AI traffic arrives without referrer data and is recorded as direct traffic, so read this as a trend rather than an exact count.
For more on how brand mentions influence AI answers, see our post on Reddit mentions and AI search.
Layer 4: Business Impact and Digital PR ROI
This is the layer leadership cares about most, and the one most PR reports skip.
Leads and conversions. Track conversions from PR referral traffic, plus assisted conversions, where a visit from coverage came earlier in the buyer’s journey. GA4’s attribution reports can show both.
What your CRM shows. Add a “How did you hear about us?” field to forms and sales calls, and ask your sales team to note when prospects mention an article. This qualitative evidence often captures influence that analytics misses.
Cost per link and cost per placement. Divide the cost of a campaign by the quality links or pieces of coverage it earned. It’s a simple efficiency check for comparing campaigns, and a useful benchmark against other ways of earning links. Compare campaigns of a similar type, since a national data study and a run of reactive comments will rarely cost the same.
ROI. The standard formula is:
(Revenue attributed to PR − Cost of PR) ÷ Cost of PR
Be honest about its limits. PR rarely produces a clean last-click sale. It influences buyers across several touchpoints, sometimes months before they convert. Present ROI as a conservative estimate built on attributed revenue, and back it up with the outcome metrics from layers 2 and 3.
This approach is in line with the Barcelona Principles 4.0, the industry measurement standards published by AMEC in 2025, which call for communication to be judged by its outcomes and impact, not by activity alone.
What this looks like in practice
In our work with a long-established healthcare brand, we reported across these layers rather than on links alone. Over roughly two years, the program built 2,797 backlinks at an average of about 115 a month. Average monthly organic visits grew from around 3,000 to around 12,000, roughly four times the starting point. On the AI side, the brand recorded 688 appearances in Google AI Overviews, with 286 of its pages cited across AI platforms. Because the program combined digital PR with community engagement and sponsored publisher placements, we present these as program results rather than attributing all of them to coverage alone.
Digital PR Metrics to Stop Reporting (or Treat With Care)
Some popular metrics do more harm than good in a report:
- Advertising value equivalency (AVE) and earned media value (EMV). These estimate what coverage would have cost as advertising. The Barcelona Principles 4.0 call AVEs an invalid measure and treat related variants the same way. Drop them.
- Domain Authority and Domain Rating. SEO tool vendors create these scores; Google doesn’t use them as signals. They’re useful for quickly judging a publication, but they aren’t results.
- “Potential reach” and impressions. These figures are usually based on a publication’s total monthly audience, which greatly overstates how many people saw your story.
- Raw link counts. Without filtering for relevance and quality, a big number can hide weak placements.
A Simple Monthly Digital PR KPI Report
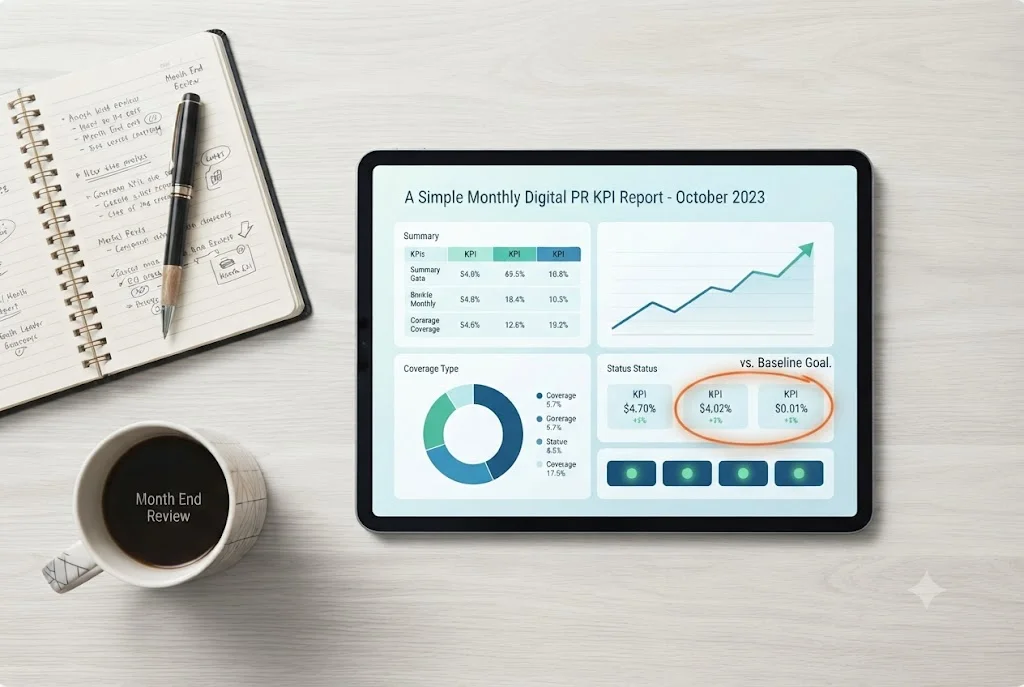
Keep the report short enough to read in five minutes. A table like this works well:
| Layer | Metric | This month | Baseline | Note |
|---|---|---|---|---|
| Coverage | Quality links (followed / nofollow) | Top 3 placements | ||
| Coverage | Coverage by tier (national / trade / local) | Sentiment mix | ||
| Search | Referral sessions and engaged sessions | |||
| Search | Rankings for target pages | |||
| Search | Branded search clicks; share of voice | Vs. top competitor | ||
| AI visibility | Brand mentioned in buyer questions (x of 20) | Sources cited | ||
| Impact | PR-referred and assisted conversions | Sales feedback | ||
| Impact | Cost per link / placement |
Report monthly, and review against your original goals each quarter. Single months are noisy; trends over a quarter are what matter. For realistic expectations, around half of practitioners (51.4% in BuzzStream’s survey) say measurable results appear in three to six months.
Measure What Proves Your Goal
Good digital PR measurement isn’t about the longest list of metrics. It’s about choosing the few that prove your goal, recording a baseline, and reporting in layers that move from coverage to business results. Add AI visibility now, while many brands still aren’t tracking it, and give quarterly trends more weight than any single month.
If you want a team that plans campaigns around measurable goals and reports on what actually matters, take a look at our digital PR services. For background on the channel as a whole, see our complete guide to digital PR.
FAQs
How long does it take to see digital PR results?
First coverage can come quickly: in BuzzStream’s 2026 survey, 81% of practitioners secured coverage within a week of their first pitch. Wider results take longer. Just over half (51.4%) see measurable results in three to six months, as links, rankings, and brand search build up.
What metrics should a digital PR report include?
Include one or two metrics from each layer that connect to your goal: quality links and coverage by tier, referral traffic and branded search, AI mentions, and conversions or cost per link. Quality links are the most widely used measure, but business impact is what convinces leadership.
How do you calculate digital PR ROI?
Subtract the cost of PR from the revenue you can attribute to it, then divide by the cost. Because PR influences buyers across several touchpoints, treat the result as a conservative estimate and support it with traffic, branded search, and CRM evidence.
Is earned media value a good way to measure PR?
No. Earned media value and advertising value equivalency estimate what coverage would have cost as an ad, which says nothing about whether it changed anything. The Barcelona Principles 4.0 call AVEs an invalid measure and recommend judging communication by its outcomes and impact instead.